How to Set Up a Monitoring Dashboard for Remote Team Leads
Patrick Bushe
October 2, 2024 · 5 min read
Leading a remote team means you can't see who's stuck or what's slipping by walking around the office. A simple dashboard of the team's work gives you that picture at a glance. The key word is work: good dashboards track progress and blockers, not people's every move.
What to include
- Work in progress: your project board filtered to the current sprint or week.
- Blockers: a saved filter of blocked or overdue items.
- Delivery signals: build or deploy status, if your team ships software.
- Customer signals: the support queue or open tickets.
- Availability: the team calendar, showing time off and focus blocks.
- Two or three key numbers, such as weekly sign-ups or response time.
Free and common tools
- Project tools: Jira dashboards, Trello, Asana and Linear all offer saved views and filters.
- Charts: Looker Studio is free and connects to spreadsheets, Google Analytics and many other sources.
- Spreadsheets: a shared Google Sheet with a summary tab works for small teams.
Rotate views on a second screen
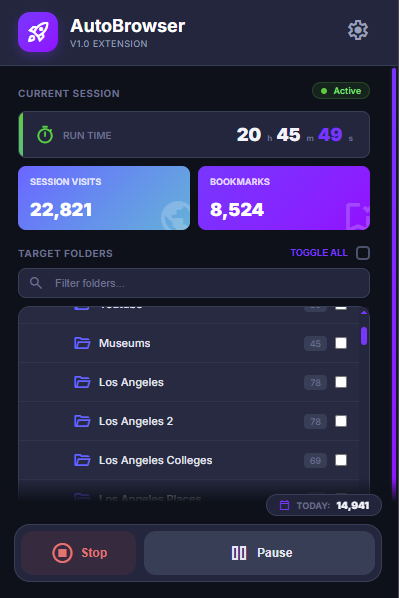
Bookmark each view in one folder. AutoBrowser plays the folder in a single tab, showing each page for a time you choose and looping, so a second monitor keeps cycling through your dashboard without you clicking. See rotating boards on a screen.
Keep notes alongside
When something on the dashboard needs follow-up, write it down straight away. Sticky Notes Anywhere keeps notes and checklists in a browser panel, so your one-on-one topics are ready when you need them.
Check your meeting load too
Remote teams often add meetings to make up for not seeing each other, and focus time disappears. Meeting Cost Calculator shows a meeting's cost as it runs, which helps when deciding which recurring calls to keep. See async standups.
What to avoid
- Activity monitoring: keystroke counts, mouse tracking and screenshot tools measure activity, not results, and damage trust.
- Online status as a metric: a green dot doesn't mean good work.
- Too many charts: if you can't read it in 30 seconds, simplify.
Use it as a conversation starter
A blocked ticket or slipping deadline is a reason to ask "how can I help?", not to assign blame. Share the dashboard with the team, so everyone sees the same picture. See building a dashboard display.